

NOW ACCEPTING VINEYARDS · 2026 SEASON
VINEYARD MONITORING · PROJECT VOXEL
Monitor vineyard health
throughout the
growing season
.
Project Voxel combines drone, satellite and field-level observations to help growers monitor crop condition, identify variability and track changes across the season.
View monitoring programme
Start with a Health Check
HOW MONITORING WORKS
Four layers of evidence, one continuous view.
Each programme combines field captures, spectral analysis, platform insights and continuous access. The components are the same — what changes is how often, and how much of the season Project Voxel can compare against.

01 · Field captures
Multispectral imagery
Drone-mounted multispectral sensors capture detailed imagery over your blocks at each monitoring visit — resolving canopy detail that satellites cannot.

02 · Analysis
Spectral & trend analysis
Project Voxel processes each capture for canopy vigour (NDVI), chlorophyll signal (NDRE) and within-row variability — and compares it to the season so far.


03 · Insights
Platform insights
Project Voxel highlights variability, trends and areas requiring attention directly within the platform, helping growers focus effort where it matters most.

04 · Platform
Platform & satellite monitoring
View your vineyard data in the Project Voxel platform between visits. Weekly satellite-derived imagery keeps the picture current, even when nobody is on site.
WHY IT MATTERS
You can’t be everywhere in the vineyard at once.
Walking the rows is essential. It is also impossible to do at the cadence and coverage that early-season decisions deserve. Project Voxel helps growers:

Identify variability across blocks

Detect potential issues earlier

Prioritise scouting effort, row by row

Monitor changes over time

Build a clearer picture of vineyard performance
The goal is simple: better information leads to better-informed decisions.
WORKING WITH VINEYARDS IN NEW ZEALAND AND THE UNITED KINGDOM
Currently monitoring 16 sites across two hemispheres.

Vineyard monitoring
Multispectral drone imagery
Satellite monitoring
Seasonal trend analysis
Early crop stress detection
11
UK sites
5
NZ sites
2
hemispheres
TWO WAYS TO START
Choose how much of the season you want to see.
Start with a one-off snapshot, or join the Seasonal Programme and watch the picture build through the year. The Seasonal Programme is our recommended starting point — the value of monitoring is in the comparison across time.
ENTRY-LEVEL
Vineyard Health Check
A one-off snapshot of vineyard performance.
£750
+ VAT · one-off

One monitoring visit
Multispectral drone capture
Spectral analysis
Platform insights and analysis
Platform access
Satellite monitoring following the visit
Choose Health Check
PRIMARY OFFER
Seasonal Vineyard Monitoring Programme
Understand how conditions change throughout the season.
£2,250
+ VAT · per season

Four monitoring visits across the season
Multispectral drone captures at each visit
Trend analysis across captures
Seasonal trend analysis
Access to the Project Voxel team
Platform access
Weekly satellite monitoring between captures
Start the Seasonal Programme
RECOMMENDED
Pricing shown applies to vineyards up to 10 hectares. Larger vineyards, estates and multi-site operations are quoted separately.
Introductory pricing for the 2026 season. Pricing may be revised for future seasons as the platform and monitoring programme continue to evolve.
Backed by our Vineyard Guarantee — full refund if your first monitoring visit doesn’t provide value to your operation.

OUR Insights GUARANTEE
We’re confident the platform will earn its place in your season.
If you don’t believe the first monitoring visit provides
value to your operation
, we’ll refund your fee in full.
BEYOND A SINGLE SNAPSHOT
The real value begins when data can be compared across time.
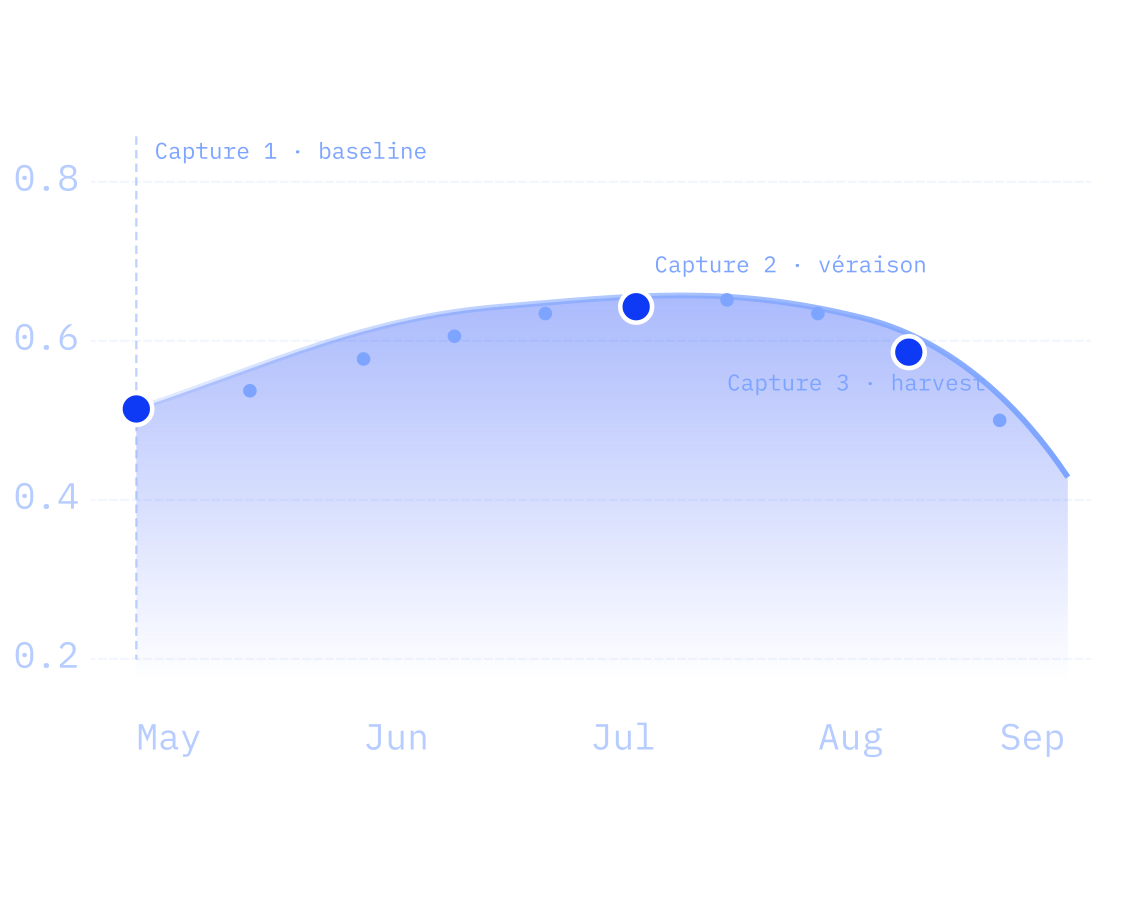
A single capture is a snapshot. A season of captures — with weekly satellite imagery between them — is a trend line. Snapshots tell you where you are. Trends tell you where you’re going.

Emerging stress
Catch declines in canopy vigour weeks before they show in the cab — while there’s still time to respond.

Recovery after intervention
See whether an irrigation change, a foliar pass or a remedial action actually moved the dial — in the data, not in hindsight.


Seasonal variability
Compare bud-burst, flowering, véraison and harvest in one view. Understand whether this season is tracking ahead, behind or to plan.

Block performance trends
Rank blocks by trajectory, not just current state. Identify which corners reliably outperform — and which ones consistently lag.


Areas needing investigation
Direct scouting walks to the rows the data has already flagged. Less ground covered, more questions answered.
NOW ACCEPTING VINEYARDS · 2026 SEASON
See how your vineyard changes through the season.
We’re accepting a limited number of vineyards onto the 2026 monitoring programme. Book a short introductory call to discuss the right starting point for yours — the Seasonal Programme or a one-off Health Check.
Book a call
Email the team

Precision crop monitoring — combining satellite, drone and ground data into one operational view. Built in Scotland, deployed globally.
PRODUCT
Platform
Results
Vineyards
Pricing
COMPANY
About
Team
Contact
RESOURCES
Insights
Knowledge base
Support
© 2026 Project Voxel Limited · Company No. SC848267
Built in Scotland · Deployed globally